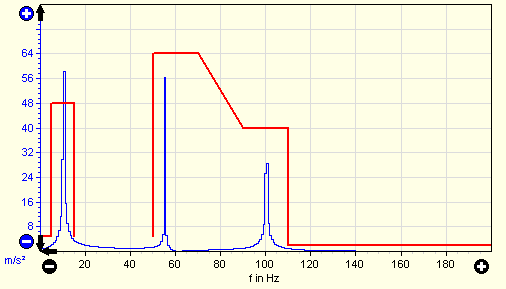
You can set up a frequency-selective limit curve for the analyzed data. On the one hand, it allows a quick optical check with regard to exceedance. On the other hand, it can be used for automated annunciations as well.
The limit curve allows to set up arbitrary linear segments, also with gaps.
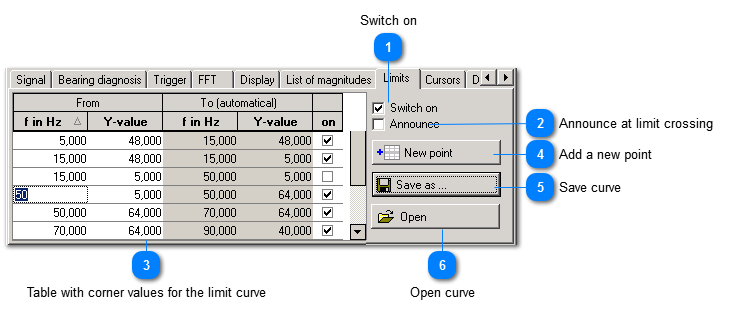
 Switch on
|
|
Activates the limit function.
| |
|
 Announce at limit crossing
|
|
If this checkbox is activated, annunciators will be activated in case of exceedance of the limit curve. | |
|
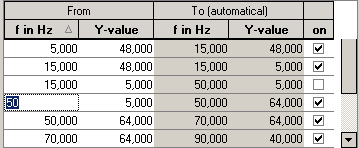
 Table with corner values for the limit curve
In this table, you can set up the limit curve point by point. The table contains the columns From and To. You can only change the coordinates in column From: Click right on a field and enter the value. Alternatively, a point in the spectrum can be moved by using the mouse.
In the last column you can select whether the point is to be drawn or not. This way, you can add gaps to the limit curve.
By clicking right on a row, you open a context menu which offers the deletion of a row.
|
|
 Add a new point
This button creates a new point in the table. The new point takes over the coordinates of the previous point. You can enter new coordinates. |
|
 Save curve
 This button saves the limit curve in a file. |
|
 Open curve
 This button loads a limit curve from a file. |
|