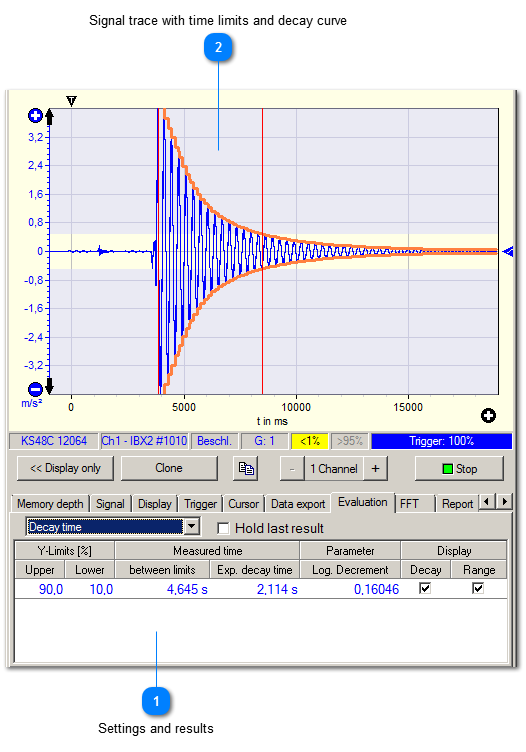
If a signal trace is measured after triggering VM-SCOPE+ can envelope the signal automatically and draw a decay curve. Decay time and exponential decay time are displayed. Furthermore the logarithmic decrement is output.
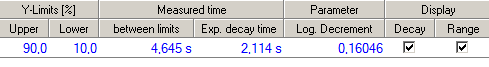
 Settings and results
-
Two limits can be set for decay time measurement. These Y-Limits mark the magnitudes limits between which VM-SCOPE+ calculates the decay time. The table shows the magnitudes on both ends in percents of the maximum magnitude and the time between them. The limits and the curves can be displayed in the diagram. -
Time for decay between limits is automatically measured and displayed. Additionally, the decay curve is approximated to an exponential function in order to determine the exponential decay time. Furthermore, the logarthmic decrement is calculated out of the decay curve. -
The decay curve and the range set by the limits can be selected for display.
|
|
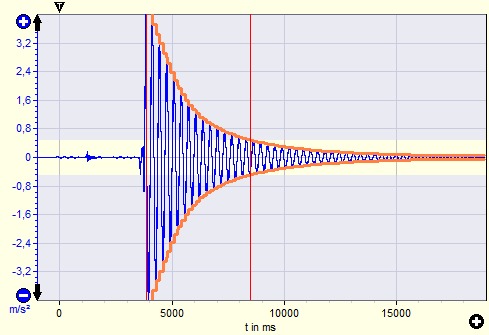
 Signal trace with time limits and decay curve
-
The vertical red lines mark the beginning and the end of the decay process. -
The horizontal stripes mark the range of the decay process in y-direction. -
The orange curve displays the envelope of the decay process.
|
|