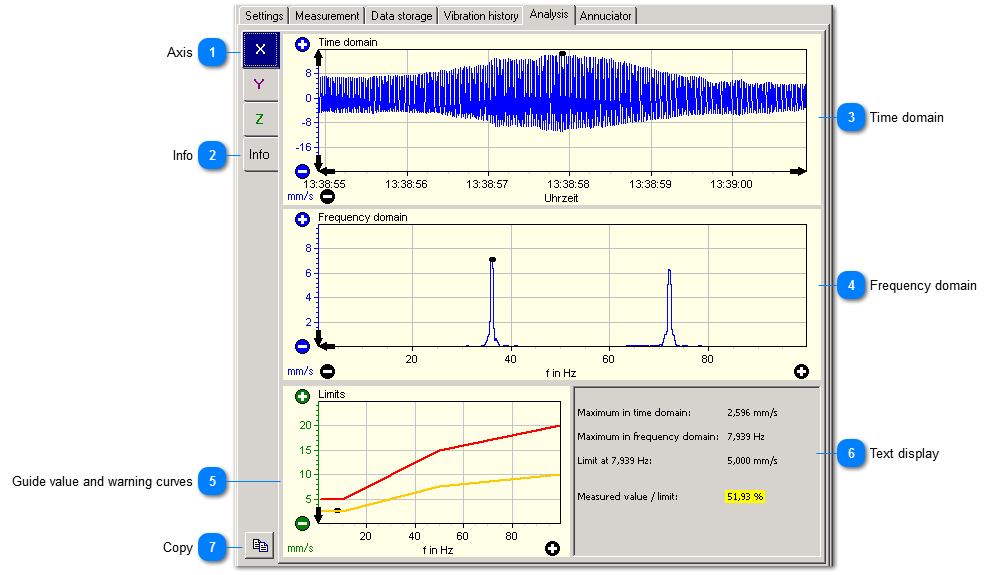
If you select an event in the
data storage VM-STRUC+ can perform an analysis provided that
time signal recording was enabled.
 Axis
|
|
There is an analysis for each axis direction. The first shown analysis always belongs to the direction with the most critical magnitude.
| |
|
 Info
|
|
Information concerning the file location.
| |
|
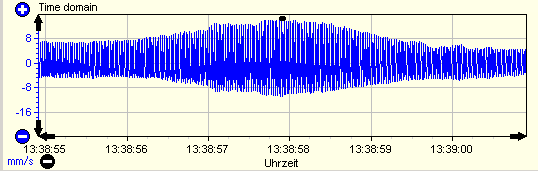
 Time domain
Band filtered vibration velocity in time domain. The peak magnitude is marked.
|
|
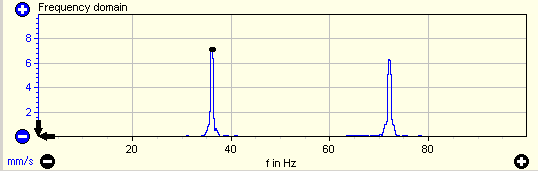
 Frequency domain
Band filtered vibration velocity in frequency domain. The peak magnitude is marked.
|
|
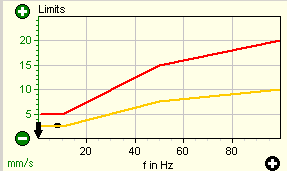
 Guide value and warning curves
This diagram shows the signal (as a black mark) in comparison with the guide value and the warning limits.
The guide values are frequency dependent for short-time vibration.
|
|
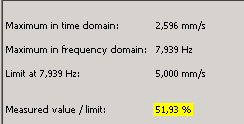
 Text display
|
|
Here you find the most important characteristics calculated from the analysis.
| |
|
 Copy
Copies the analysis data to the clipboard for use in reports.
|
|